Tools & Products

Research software that makes complex evidence explorable.

Our published visual analytics systems span medication safety, high-dimensional EHRs, multimorbidity, predictive modeling and pharmacovigilance. Each tool is presented as research software with a focused analytical purpose; published system figures are shown where available.

IRVINE interface from the published paper
Featured system
2026 · Pharmacovigilance & data quality

IRVINE

IRVINE is an interactive visual analytics system for characterizing missingness and reporting completeness in spontaneous-reporting databases. It supports temporal exploration and cross-database comparison so data-quality limitations can be examined before downstream signal analysis.

Why it matters: pharmacovigilance results are only as trustworthy as the underlying reports. IRVINE makes data quality visible as part of the analytical workflow.

SUNRISE interface from the published paper
2022 · Predictive visual analytics

SUNRISE

SUNRISE combines frequent itemset mining, machine learning and coordinated visualizations to help users examine how laboratory-test patterns relate to predicted disease outcomes.

VERONICA interface from the published paper
2021 · Feature-group discovery

VERONICA

VERONICA supports interactive identification and comparison of feature groups that contribute to disease classification, helping users examine model-relevant structure in electronic health records.

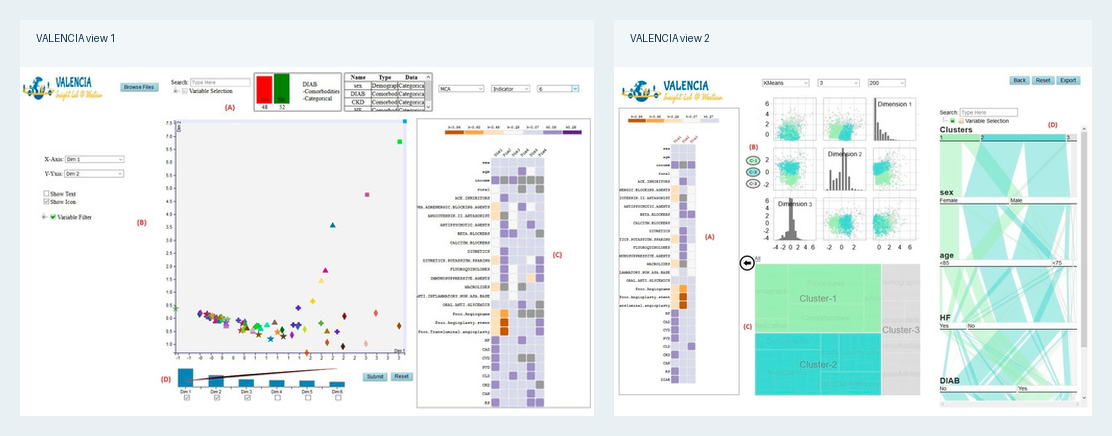
Two VALENCIA interface screenshots from the published system
2020 · High-dimensional EHR exploration

VALENCIA

VALENCIA combines dimension reduction, clustering and coordinated visual views to explore high-dimensional electronic health records and compare patient clusters across clinical variables.

VISA_M3R3 interface from the published paper
2020 · Medication safety & AKI

VISA_M3R3

VISA_M3R3 integrates multiple regression, frequent itemset mining and coordinated visualizations to investigate medication-associated acute kidney injury and relationships among medications, covariates and outcomes.

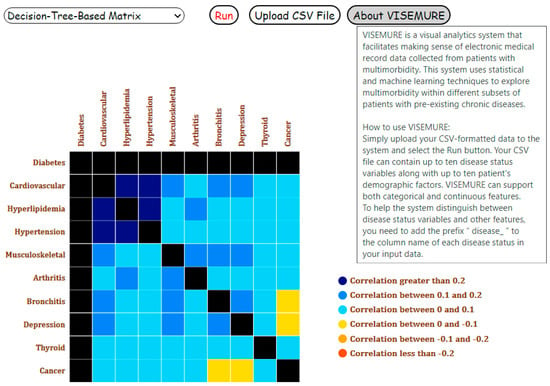
VISEMURE interface from the published paper
2021 · Multimorbidity analytics

VISEMURE

VISEMURE provides coordinated interactive views for exploring multimorbidity patterns and relationships among co-occurring conditions in electronic medical record data.

Visual analytics lineage

A sustained research program.

The systems form a sustained visual-analytics program that evolved from EHR exploration and medication safety toward prediction, feature-group discovery, multimorbidity analysis and post-market data quality.

2020VISA_M3R3 · VALENCIA
2021VERONICA · VISEMURE
2022SUNRISE
2026IRVINE
Growing platform

New tools can live under AI4Health.

The website will host future research applications in this area. Please contact us to get notified.